
Envoy Fundamentals

What is Envoy?
What is Envoy?
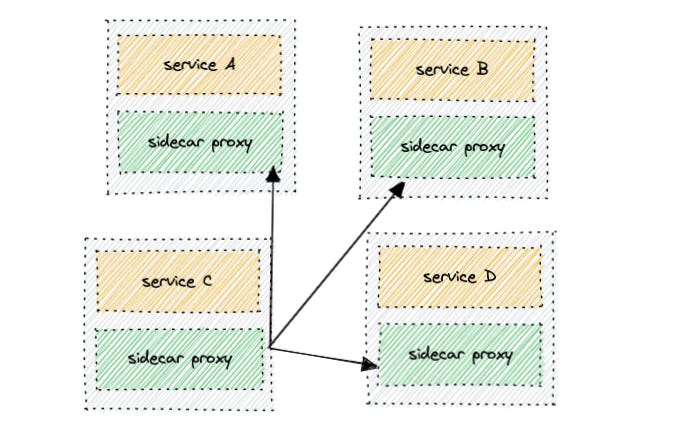
Envoy proxy is a modern, high-performance, edge and service proxy originally built at Lyft and then matured into a CNCF project. With envoy, services can communicate to other services seamlessly while the features of networking are transparent. Envoy comes preloaded with batteries which takes care of observability, authentication, authorization, monitoring/stats, retries, circuit breakers, etc. The services coupled with envoy sidecars become the backbone
of a service mesh. All configurations needed to communicate are managed by the control which pushes the configuration to the data plane where the core of communication lies.
The major design goals of envoy falls into the following features:
Out of process architecture
Low latency, high performance and improved developer productivity
L3/L4 filters architecture
Service/configuration discovery via API
Active/passive health checking
Advanced load balancing
Best in class observability
Hot restart
Extensibility
Why Envoy?
As the business grows, the need for separating concerns of the business logic expects us to break down monoliths into micro-services. With
microservices, there comes additional pain to implement and paint a lot of features of distributed systems including but not limited to
filtering, routing, access loggers, health checkers, retry policies, resource monitors, stats sink, L4/L7 filters, observability, tracing, custom load balancing, A/B testing and this brings in a lot of complexity to the application logic and it’s
related client libraries are written in various programming languages. Envoy helps us in abstracting away these complexities by its high performance and
customizable approach by including all these features included out of the box allowing a seamless way to communicate amongst each other
There are more to including production quality and velocity, extensibility, pluggability, eventually consistent configuration APIs, no “open core/paid premium” version and
community contributions.
How Envoy Works?
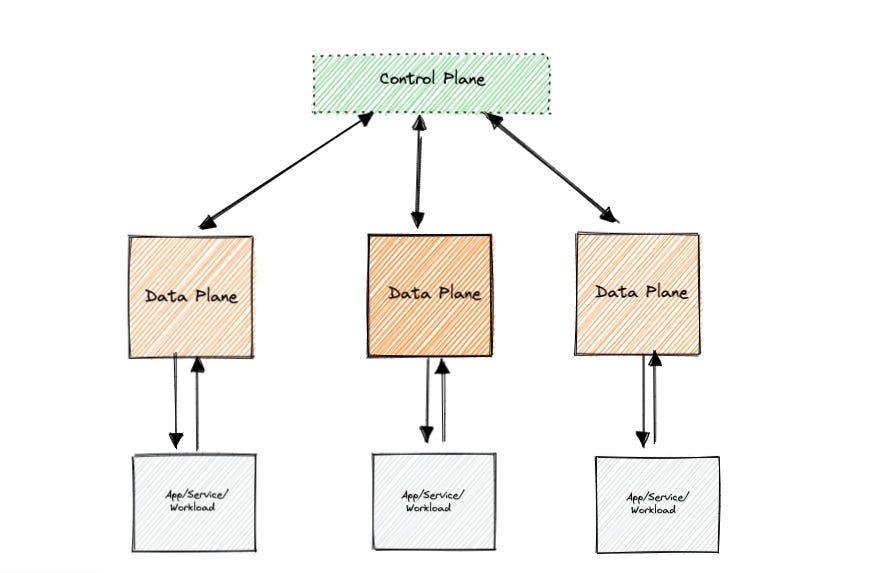
Envoy can be attached as a sidecar with your existing application proxying both ingress(incoming) and egress(outgoing) requests. All the envoy sidecars that are coupled together with the application form a data plane. The data plane is responsible for entire service-service communication. When the app comes up, the envoy sidecar notifies the presence of the control plane then registers a particular service, and then dynamically loads the configuration into the sidecar for further communication. Control Plane and Data Plane form what we call envoy. configuration can be dynamically loaded via API (awesome )
Key takeaways of Control Plane
uses an API to integrate with other platforms for service discovery and similar tasks
responsible for managing the configuration of the mesh, which includes policies, routing, available services, etc
programs the data plane in a data plane specific way to implement the configuration represented in the control plane
generally out of band, so control plane outages typically don’t affect connectivity across the mesh (only affects the ability to make changes)
communicates to the data plane
Key takeaways of Data Plane
communicates to application/services
is programmed by the control plane
responsible for actually passing traffic between computing units (containers, VMs, bare-metal systems, etc)
since it is “in-band”, data plane performance/overhead is a key concern
Let’s go a little deep into the building blocks of what makes envoy interesting. The envoy has the following modules
to proxy, a request to the end host and these are the following

listeners
filters
routes
clusters
endpoints
Listeners
– associated with IP and port
– traffic that enters is captured by the listener and then passes through
– initial pre-connection phase, work with raw data (l4)
Filters
– each listener has a filter e.g. TCP proxy (L4) – not application-aware
– HTTP filter – unpacks the traffic, headers, host, what are the paths, query params being submitted (HTTP knowledge aware)
– if you are asking www.site1.com one way or www.site2.com – another way
– filters are chained together. continue or stop the chain
– HTTP requests and responses (l7) – they can manipulate them
– network filters including raw data (l4) and HCM (HTTP connection manager)
Routes
– matches /API – to destination and /API/v1 to a different destination, acts as an (L7) proxy
where does that traffic need to go
Clusters
– the cluster is the destination
– a cluster can be a single endpoint, or 10 endpoints (lb)
Endpoints
– end hosts
Other than the modules defined above, the control plane has something called xDS APIs( collection of APIs) which make the control plane extensible and pluggable. The features of xDS APIs are following:
– these APIs make it possible for the control plane to dynamically configure envoy
– think of xDS as ” x Discovery Service)
– xDS isn’t one API. it is a collection of APIs
– each major component of envoy’s configurations has an associated discovery service ( LDS for listeners, CDS for clusters, RDS for routes, EDS for endpoints, etc)
– discovery services: CDS, EDS, LDS, RDS, SDS
– gRPC or REST endpoints
– allows you to bring your control plane
Let’s get our hands dirty
In this exercise, I am going to demonstrate the functionality of the envoy by deploying two services named blue and green. The blue service responds with an HTML page painted with blue if the HTTP request URL contains blue and the green service responds with an HTML page painted with green if the HTTP request URL contains green request URL starts with green. This is more analogous to a canary deployment or Blue/Green deployment where a certain section of the incoming traffic is routed to the new version and some to the old version. Sounds exciting?
Before we begin, we need to install the following tools on our system.
Docker
curl
jq
openssl
Let’s begin by pulling the service image by
docker pull gcr.io/tetratelabs/color-app:1.0.0
The two containers run a simple Express web app that sets the background color – the first one sets the background color to blue and the second one to green.
docker run -dit --env BG_COLOR="blue" -p 5050:3000 gcr.io/tetratelabs/color-app:1.0.0
docker run -dit --env BG_COLOR="green" -p 5000:3000 gcr.io/tetratelabs/color-app:1.0.0
Let’s create a config file named config.yaml that the envoy will use to determine the filters, routes, and where to send those requests to. The contents of the file are following:
static_resources:
  listeners:
  - name: listener_0
    address:
      socket_address:
        address: 0.0.0.0
        port_value: 10000
    filter_chains:
    - filters:
      - name: envoy.filters.network.http_connection_manager
        typed_config:
          "@type": type.googleapis.com/envoy.extensions.filters.network.http_connection_manager.v3.HttpConnectionManager
          stat_prefix: edge
          access_log:
          - name: envoy.access_loggers.stdout
            typed_config:
              "@type": type.googleapis.com/envoy.extensions.access_loggers.stream.v3.StdoutAccessLog
          http_filters:
          - name: envoy.filters.http.router
          route_config:
            virtual_hosts:
            - name: all_domains
              domains: ["*"]
              routes:
              - match:
                  prefix: "/blue"
                route:
                  cluster: blue
              - match:
                  prefix: "/green"
                route:
                  cluster: green
  clusters:
  - name: blue
    connect_timeout: 5s
    load_assignment:
      cluster_name: blue
      endpoints:
      - lb_endpoints:
        - endpoint:
            address:
              socket_address:
                address: 127.0.0.1
                port_value: 5050
  - name: green
    connect_timeout: 5s
    load_assignment:
      cluster_name: green
      endpoints:
      - lb_endpoints:
        - endpoint:
            address:
              socket_address:
                address: 127.0.0.1
                port_value: 5000
admin:
  address:
    socket_address:
      address: 0.0.0.0
      port_value: 9901
Now that we have deployed our services(blue and green), we can deploy our envoy proxy using the config.yaml we have created. You could do this by using:
func-e run -c config.yaml
If the command runs successfully, you would see something like:
learn-envoy$ func-e run -c config.yaml
looking up the latest patch for Envoy version 1.21
1.21.0 is already downloaded
starting: /Users/dpr/.func-e/versions/1.21.0/bin/envoy -c config.yaml --admin-address-path /Users/dpr/.func-e/runs/1647794718452179000/admin-address.txt
[2022-03-20 22:15:18.494][1721593][info][main] [source/server/server.cc:381] initializing epoch 0 (base id=0, hot restart version=disabled)
[2022-03-20 22:15:18.494][1721593][in
...
...
...
[2022-03-20 22:15:18.508][1721593][info][config] [source/server/listener_manager_impl.cc:784] all dependencies initialized. starting workers
[2022-03-20 22:15:18.509][1721593][info][main] [source/server/server.cc:868] starting main dispatch loop
discovered admin address: 0.0.0.0:9901
Do not close this window, if you would like to run any other commands following this, open up a new terminal tab.
What have we done so far?
We have started the envoy proxy using our config.yaml which listens on port 10000. Under the envoy proxy, we have blue and green services.
Let’s go a bit deep into the config.yaml says:
As illustrated in the diagram above, what we have done is register a listener(envoy front proxy) to listen on port 10000. Since a listener is associated with one or more filter chains, we have registered an HTTP filter chain that acts as a L7 proxy. A route config is added to the filter chain which redirects HTTP traffic to the blue cluster if the HTTP URL contains blue and to the green cluster if the URL contains green. The listen port and endpoints of blue and green cluster are defined under the clusters section. If you scroll down below in the config file, the admin section defines port and address and this defines the admin panel/management console. The management console allows you to various characteristics like `statistics, cluster configuration, certificates, etc.
Now, let’s try hitting the APIs using the terminal. Let’s hit the blue service API by
Request
curl -v localhost:10000/blue
Response
➜  learn-envoy curl -v localhost:10000/blue
*   Trying ::1...
* TCP_NODELAY set
* Connection failed
* connect to ::1 port 10000 failed: Connection refused
*   Trying 127.0.0.1...
* TCP_NODELAY set
* Connected to localhost (127.0.0.1) port 10000 (#0)
> GET /blue HTTP/1.1
> Host: localhost:10000
> User-Agent: curl/7.64.1
> Accept: */*
>
< HTTP/1.1 200 OK
< x-powered-by: Express
< content-type: text/html; charset=utf-8
< content-length: 544
< etag: W/"220-F6C4mBUca6HQo4aolSGyjaKxOjE"
< date: Mon, 21 Mar 2022 02:05:25 GMT
< x-envoy-upstream-service-time: 61
< server: envoy
<
<html style="font-family:'Montserrat', sans-serif;">

<head>
    <link href="https://fonts.googleapis.com/css2?family=Montserrat:wght@500&display=swap" rel="stylesheet">
    <link rel="preconnect" href="https://fonts.gstatic.com">
    <title>
        blue
    </title>
</head>

<body style="margin: 0; padding: 0;">

    <div style="display: flex; justify-content: center; align-items: center; height: 100vh; background-color:blue; color:#FFFFFF">
        <h1 style="font-size: 8rem;">
            blue
        </h1>
    </div>
</body>

* Connection #0 to host localhost left intact
</html>* Closing connection 0
Great, we have received 200 OK response from the service but if you notice the server header in the response, you will notice that the server refers to envoy rather than the blue service. This is because the envoy acts as a front proxy which translates the request to the blue service.
Awesome!! Let’s try to open/hit the URL localhost:10000/blue in the browser and see what we receive.

Cool, now let’s try hitting the green service in the browser with the address localhost:10000/green and you should receive.
Let’s try to analyze the life of a request in envoy from the exercise
As you see from the diagram above, the listeners(a single listener) here listen on port 10000 and the request flows from the proxy to the HTTP connection manager which acts as an L7 proxy, and then to the routing layer which redirects to the right cluster depending on the URL. If the URL contains blue, we redirect it to the blue cluster or green if the URL contains green.
If you like this tutorial, feel free to share your views, comments down below. You could also email me at diljit@diljitpr.net
References and Credits